
Original submission details
Original title: 🚗 From McQueen to Mater: A Pit-Lane Case for Cluster Analysis 🔧🚜🪝
View original KEATS context ↗ (university access required).
3.8 Using cluster analysis
Please find an example of a specific situation at your job or in your daily life as a consumer in which cluster analysis might have helped you and/or your company to derive meaningful insights for better decision-making.
What was the problem? How could cluster analysis assist in solving that problem? What kind of clustering variables would have been most useful to choose to conduct the clustering?
Remember that cases or objects do not always need to be customers.
Post your example to the forum below and describe what the problem was and why you think cluster analysis would be useful in this case. Also specify what the observations (the cases or objects you would like to cluster) would be in that instance and what kind of clustering variables would make the most sense to use in your case to conduct the clustering.
Course task reproduced as context. The response below is Fiona’s independent academic work. KEATS source ↗ (university access required).
Explore writing on this question ↗At Ashwal MOT Centre in Cranbrook, I’ve noticed something for a while: our customers are nothing alike. Some people come in regularly and take great care of their cars. Others only show up for the yearly MOT, if at all. And then we have the drivers who roll in at the last minute because something started rattling or flashing on the dashboard.
Despite all this variety, we were sending out the same marketing messages to everyone. One-size-fits-all emails, reminders, and promotions. Unsurprisingly, some customers ignored us, some came in occasionally, and others were loyal without any real encouragement from us.
This got me thinking about how cluster analysis could have helped us understand who we’re actually talking to. The KEATS module made me realise just how inefficient it is to treat a mixed group as one. This is also something reflected in recent UK research, the Motor Ombudsman (2025) talked about drivers delaying repairs differently depending on personal circumstances, and UKCSI (2024) showed that satisfaction varies massively across different types of motorists.
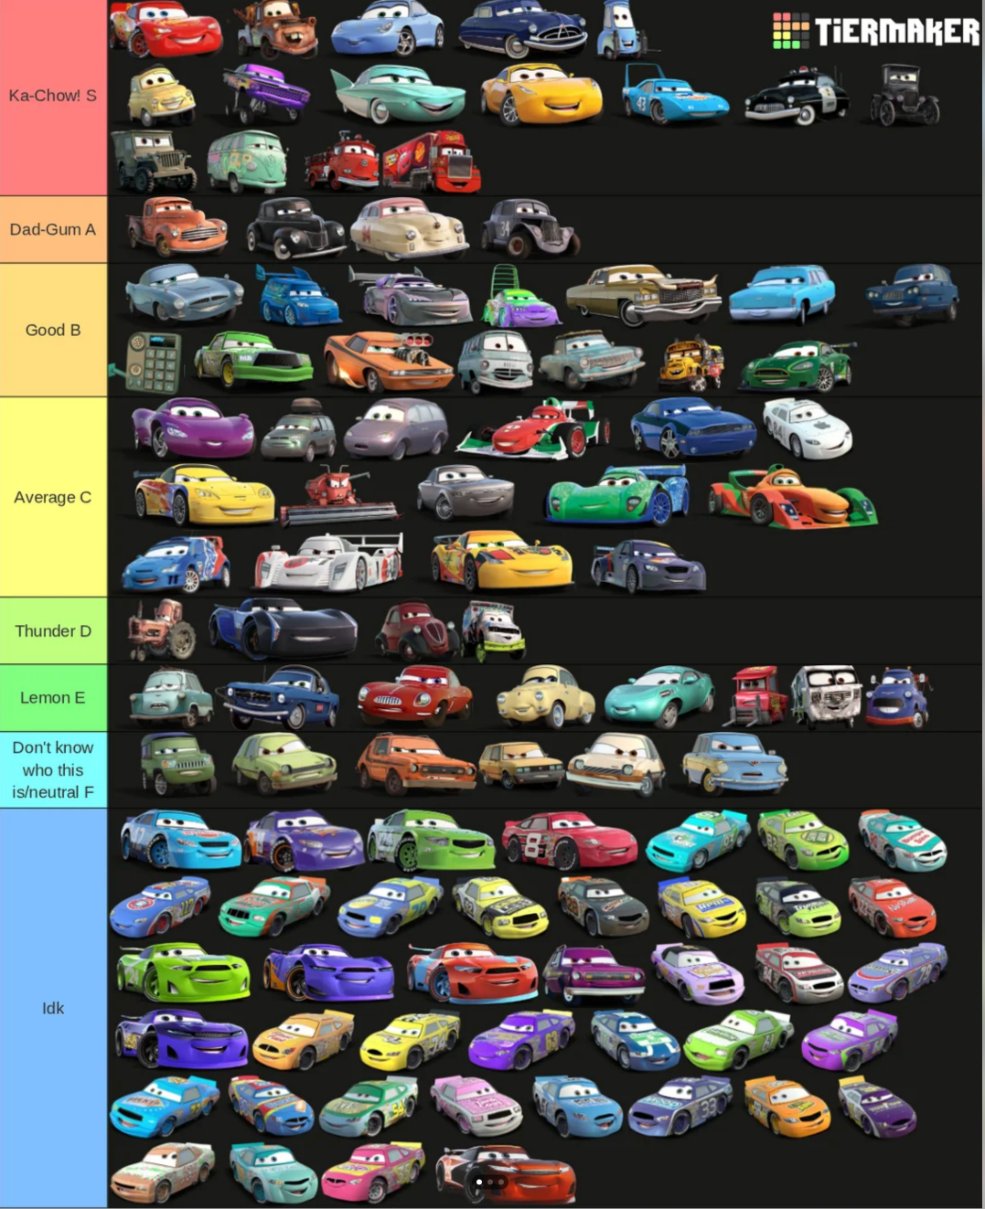
To make sense of it in my own head, I sometimes picture the customer base a bit like the characters from Disney-Pixar’s Cars. Not in an obvious way, but we genuinely get “Lightning McQueen” types: high-mileage, always on the move, and needing regular attention. We get “Sally” types: steady, loyal, organised. We get the occasional “Mater”: unpredictable, older vehicles, usually arriving with a sudden issue. And then a few “Chick Hicks”, very price-focused, MOT-only customers who appear just once a year. This little mental shorthand has actually helped me visualise how different the needs are.
What was the problem?
The main issue was that we didn’t have a data-driven way to separate these groups. Everything was blended together. We assumed the customers all wanted the same offers, the same timing, the same service — which simply wasn’t true.
It also meant we couldn’t prioritise or tailor our communications. How cluster analysis could help
Cluster analysis would break this big mixed crowd into actual meaningful groups based on their behaviour and vehicle characteristics. Instead of guessing, we could base it on:
how often they come in,
how much they typically spend,
their car’s age,
what types of repairs they usually need,
whether they respond to certain types of reminders, etc.
Once the clusters are formed, we can tailor messages and offers so we’re not wasting money on irrelevant promotions. For example:
High-mileage “McQueen” types → preventative maintenance reminders
MOT-only “Chick Hicks” → early MOT discounts
Loyal “Sally” types → VIP loyalty perks
“Mater” types → follow-up checks and care plans
It’s much more efficient and much more respectful of people’s actual needs & not over-saturate them.
What would the “cases” be?
This could work two ways:
Individual customers, which is great for marketing;
or individual vehicles, which works well in a repair/MOT context because the vehicle profile often tells the story.
Both approaches make sense depending on what we’re trying to achieve.
Useful clustering variables
Based on the KEATS rules (don’t use too many variables, avoid highly correlated ones, choose variables that actually differentiate), the ones that make the most sense for an MOT centre are:
Behavioural
Visit frequency
Annual mileage
MOT pass/fail history
Repair types
Average spend
Whether they book early or last minute
Vehicle-specific
Age of the car (our “Mater” vs “McQueen” spectrum)
Brand category
Distance from garage Attitudinal (if we had survey data)
Trust in Dan the mechanic
Comfort with visiting garages
Fairness of pricing
Service speed expectations
These reflect real differences we see daily, some people want reassurance, some want speed, some want savings.
🔧 “M.C.Q.S.”
It reminds me of McQueen but also works academically:
M – Meaningful variables
Pick the variables that actually matter.
C – Cluster procedure
Hierarchical first, k-means after to refine.
Q – Quality check
Check the cluster quality and interpretability.
S – Segment stories
Turn the clusters into understandable groups: McQueen, Sally, Mater, Chick Hicks, Doc Hudson so everyone gets their needs met.
Images from the original
References.
- AutoRepairFocus (2024). Garage anxiety remains a problem for UK consumers.
- Danatzis, I. (2024). Marketing Analytics Lecture Notes, King’s College London.
- Institute of Customer Service (2024). UK Customer Satisfaction Index – Automotive Sector.
- Kotler, P., Keller, K. & Chernev, A. (2022). Marketing Management.
- Motor Ombudsman (2025). Poll on consumer repair and maintenance behaviour.
- Parasuraman, A., Zeithaml, V. & Berry, L. (1988). ‘SERVQUAL: A multiple-item scale for measuring consumer perceptions of service quality.’
- Smith, W. (1956). ‘Product Differentiation and Market Segmentation as Competitive Strategies.’
- Wedel, M. & Kamakura, W. (2000). Market Segmentation: Conceptual and Methodological Foundations.
- Disney–Pixar (2006). Cars